home research about me cv

Research

I’m currently a Ph.D. candidate at Rutgers, and my advisor is Alyson Brooks. I’m also a member of the N-body shop collaboration. My research interests include dwarf galaxies, cosmological simulations, star formation, computational astrophysics, and more recently, machine learning.

Simulations

I use the simulations from the N-body shop, particularly the MARVEL-ous dwarfs and the DC Justice League. These simulations feature a combined total of 200+ dwarfs, with a wide variety of masses and both field and satellite environments. See a visualization below of Sandra, one of our DCJL simulations.

Your browser does not support the video tag. Video can be viewed at this link.
Here we show Sandra, one of the mint DCJL simulations. The center galaxy is Milky Way-like, and is surrounded by smaller dwarfs. The top panel shows the dark matter, the bottom left panel shows gas colored by density, and the bottom right shows stars (pink) and gas temperature (blue=cold, red=hot). Time since the Big Bang is shown. Video source

Star Formation

I’m currently updating the ChaNGa code to include more accurate models of star formation. The general picture of star formation is that stars form from interstellar gas when the force of gravity overcomes the gas pressure, and observationally this is shown to occur in small, dense structures called molecular clouds. However, other factors, including the chemical composition of the gas, turbulence, and magnetic fields can affect star formation (thus increasing the complexity of the problem). Currently, ChaNGa turns gas into stars via temperature and density criteria (once the temperature is low enough and the density is high enough, stars can form). However, real gas is turbulent, and kinetic energy from this motion can prevent the collapse of cold, dense gas. I am therefore implementing a virial parameter in the code in order to increase the accuracy of the star formation scheme.

  • ORCiD
  • Github
  • Email

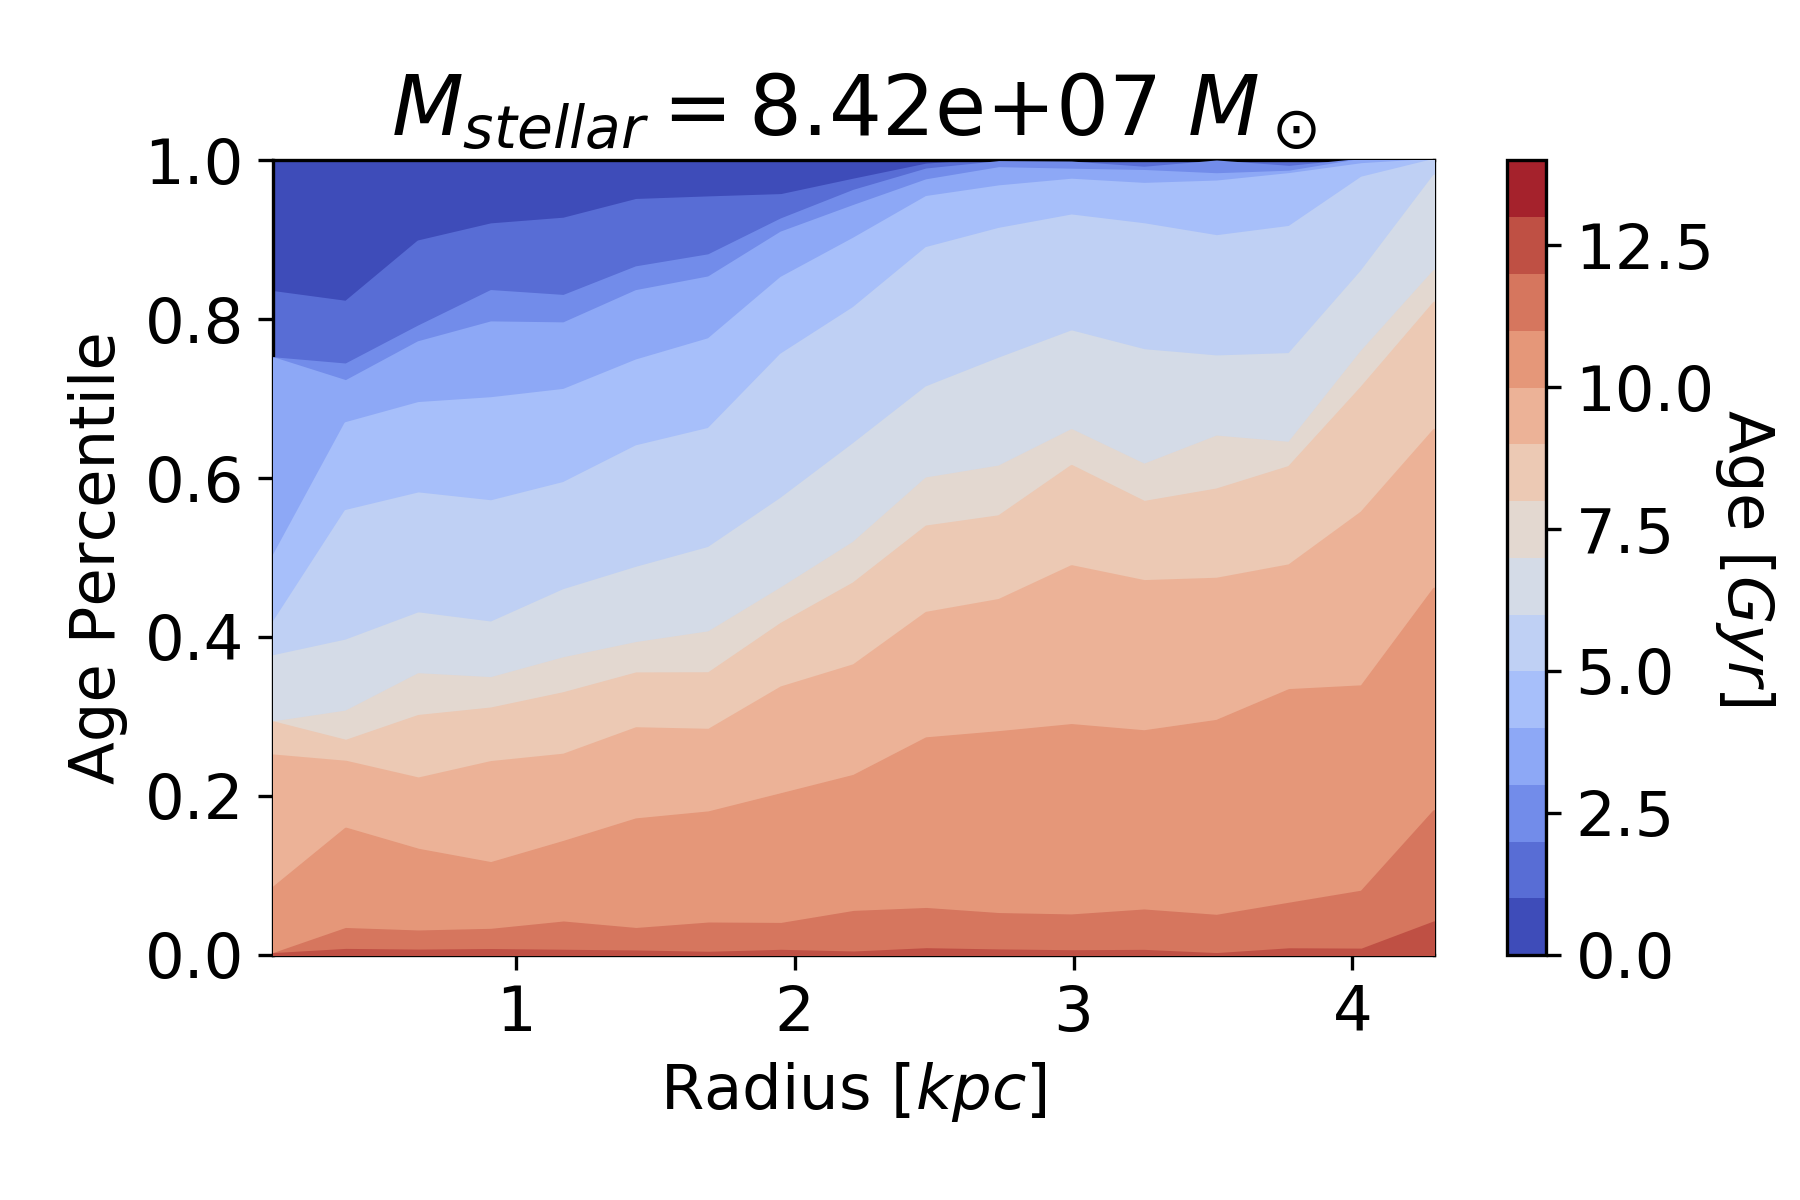
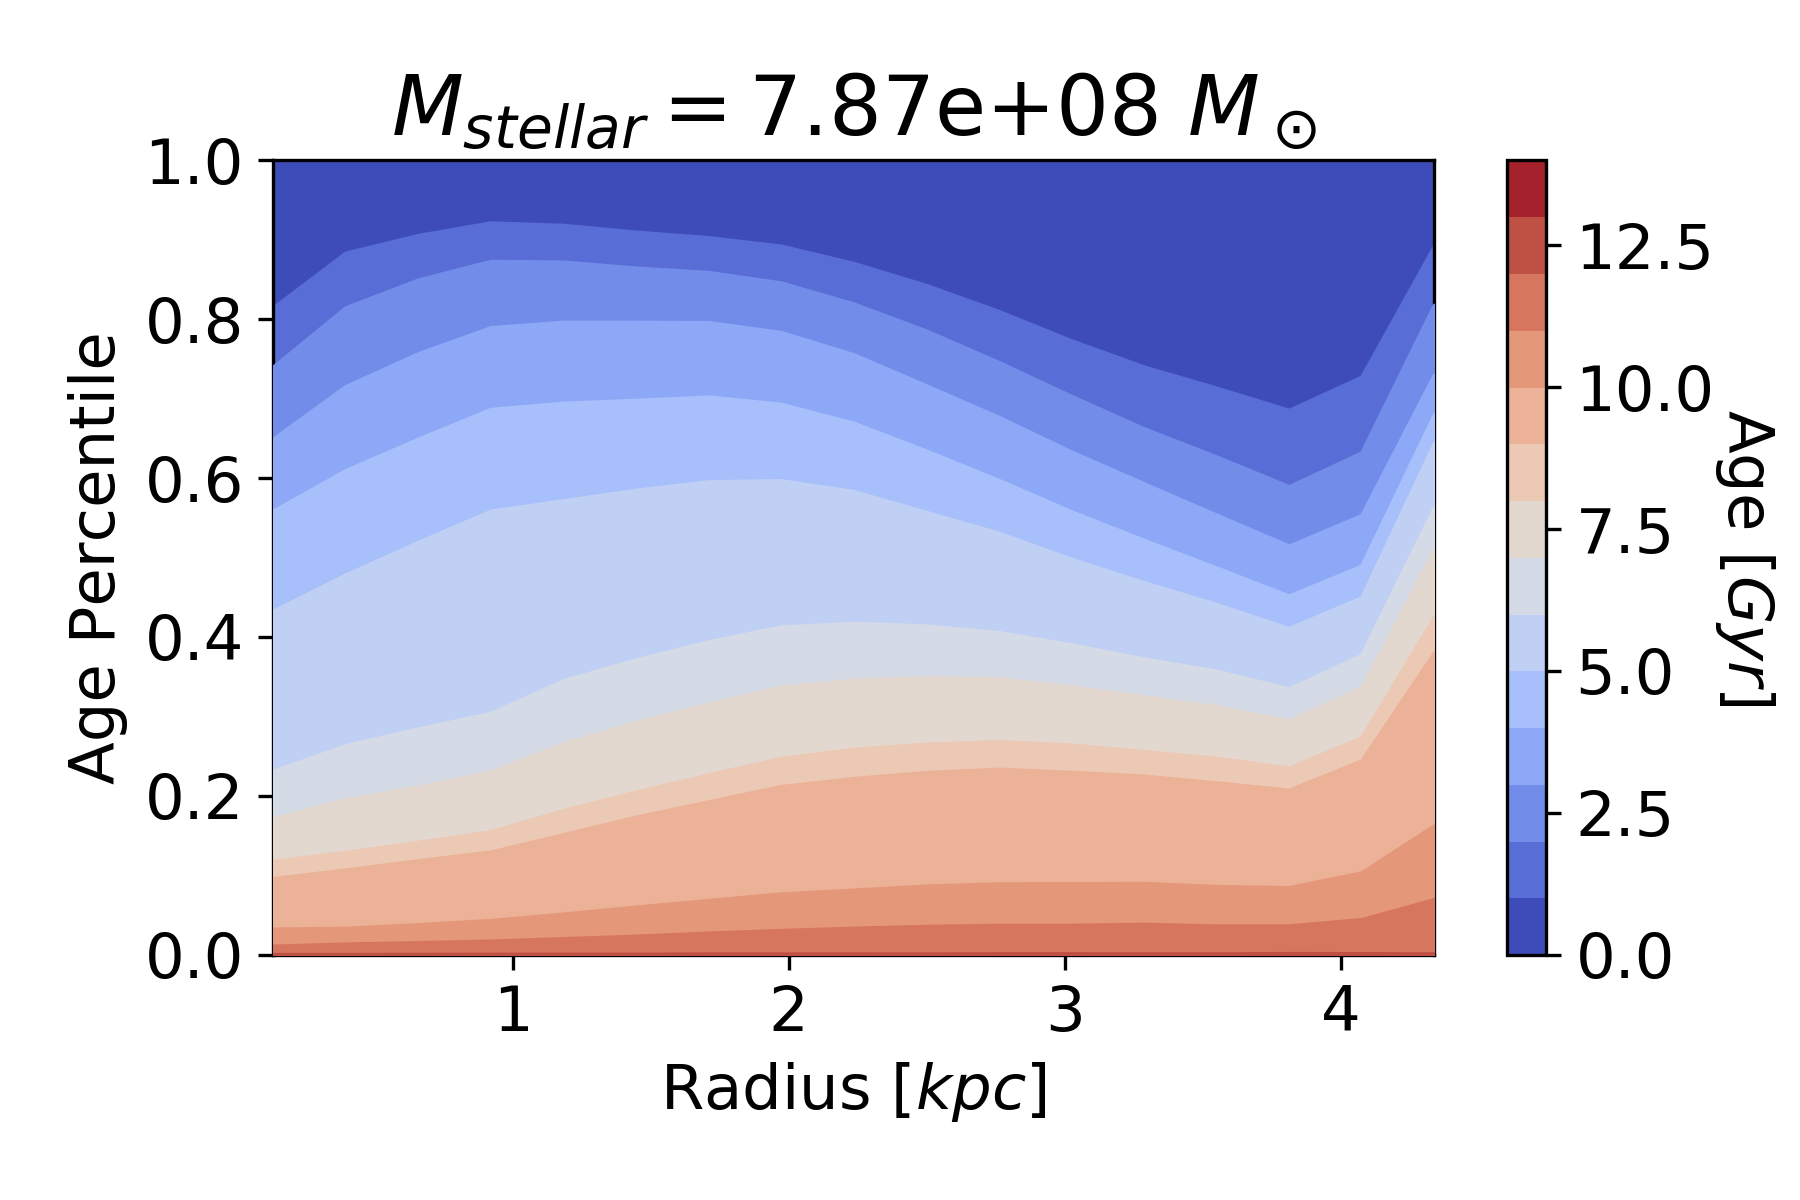
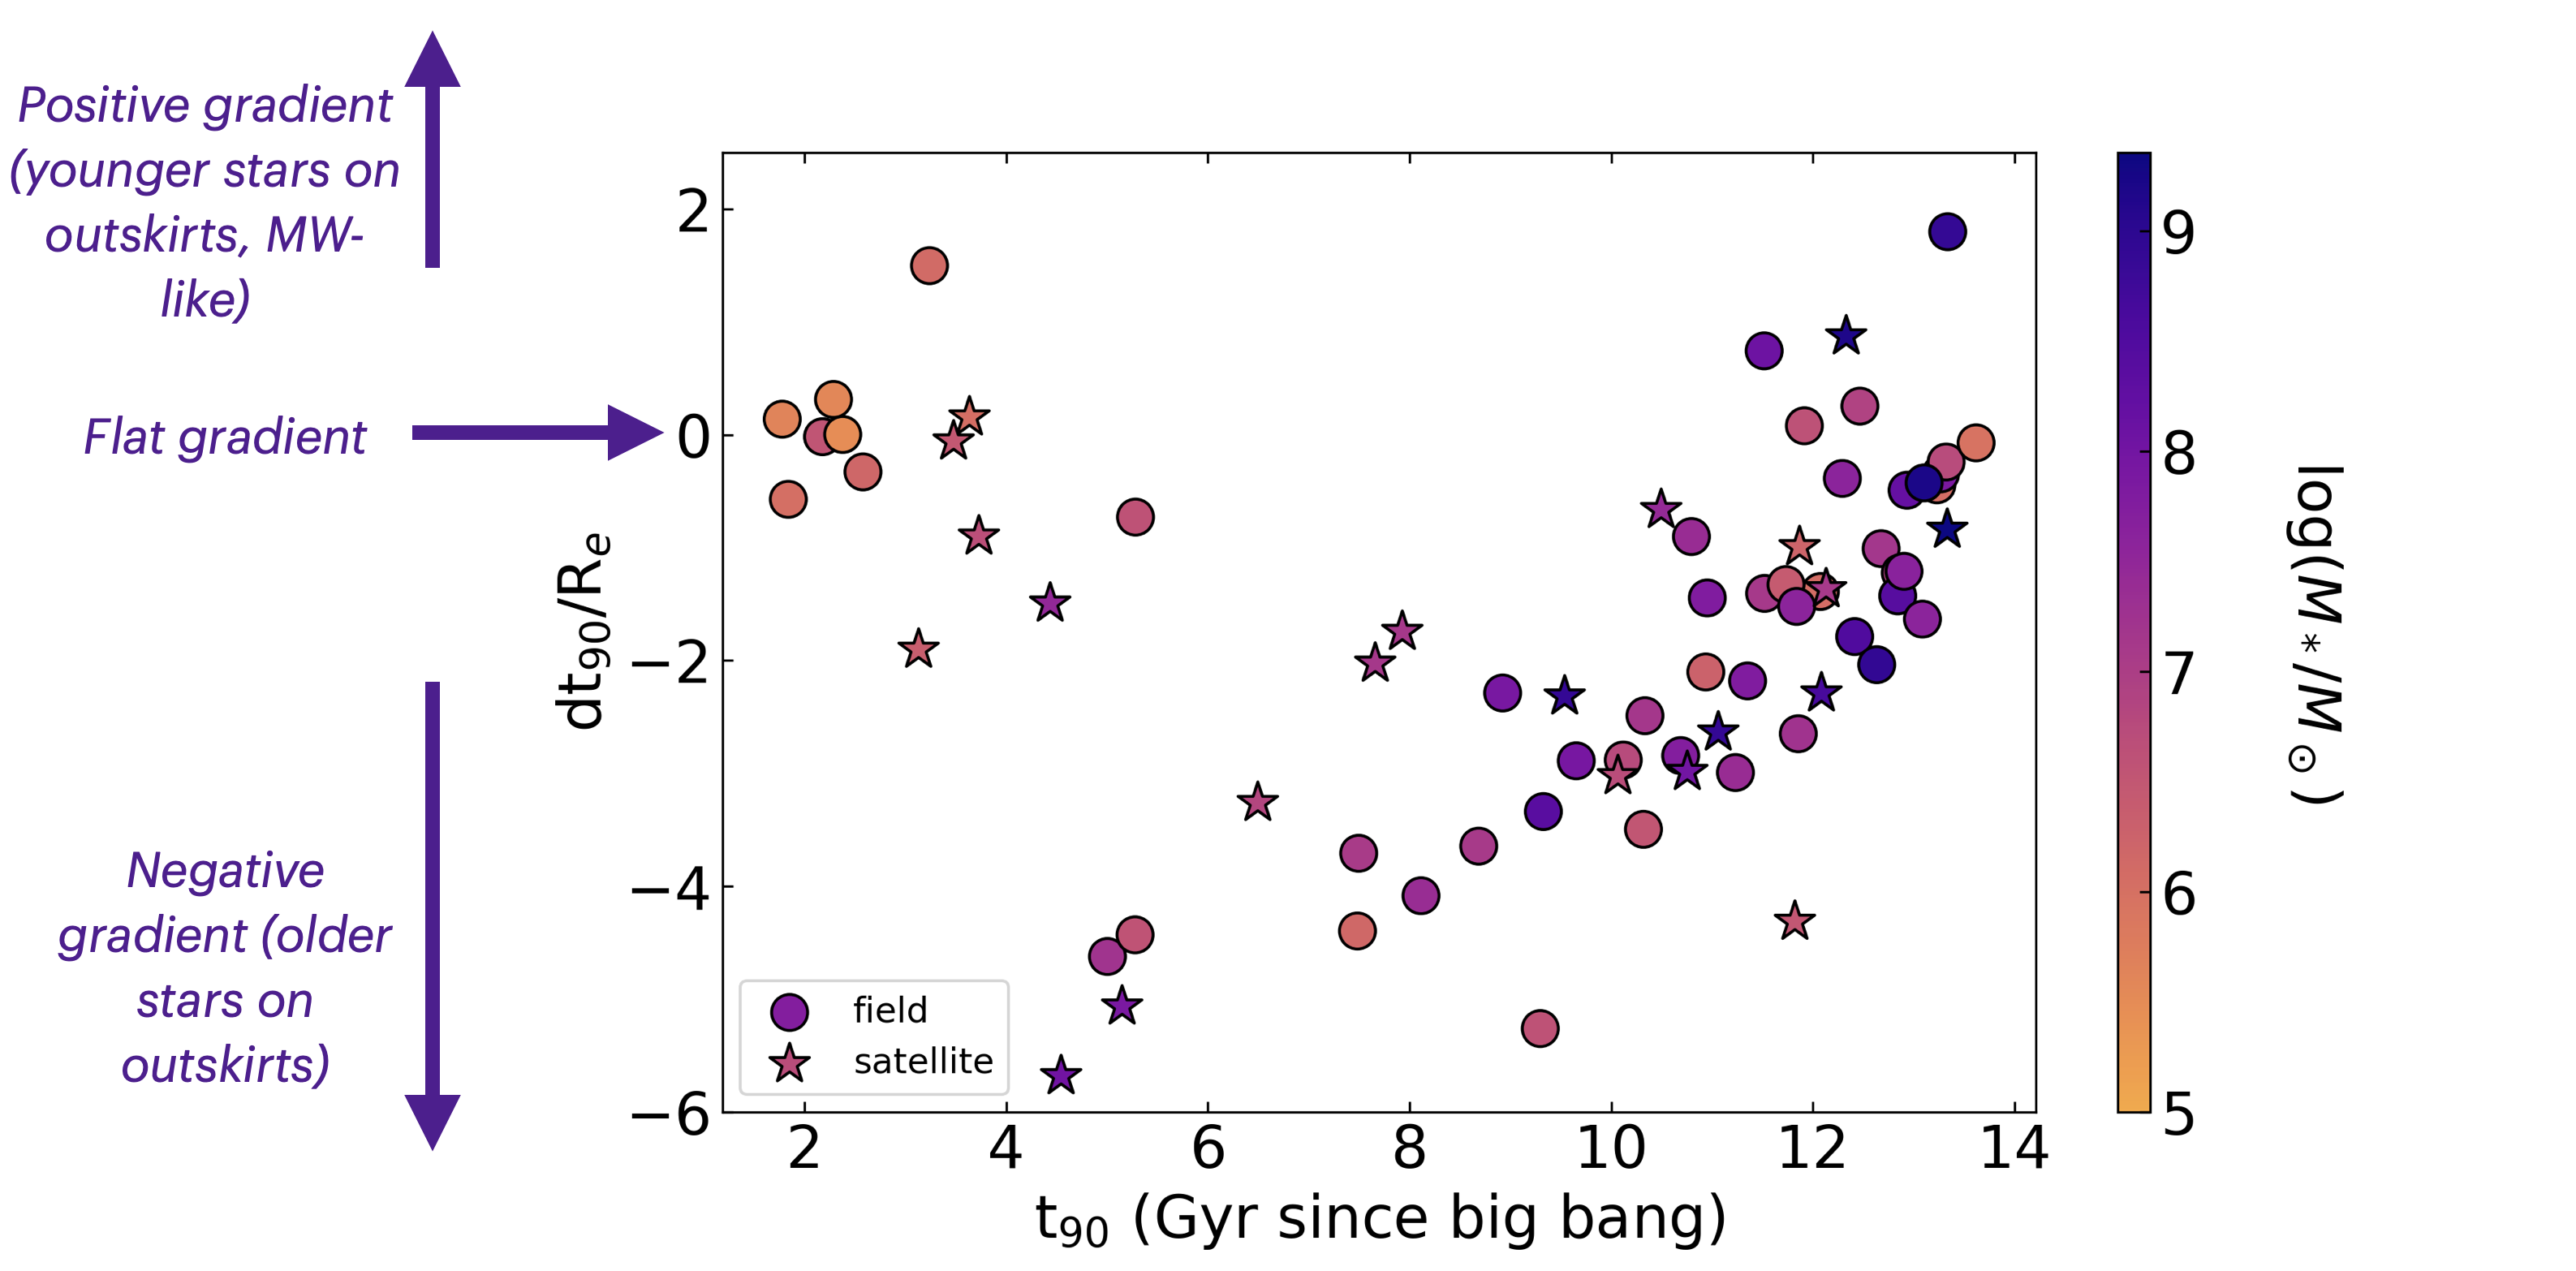
Age Gradients of Dwarf Galaxies

Please see my 2024 paper on dwarf galaxy age gradients. Observations of dwarf stellar age gradients reveal that they tend to have younger stars closer to the center of the galaxy and older stars closer to the outskirts, and this trend is found across many different types of dwarfs. Furthermore, Milky-Way (MW) type galaxies show the opposite gradient, with the oldest stars near the center and younger stars on the outskirts. The formation of MW-like gradients is well understood theoretically, while the formation of dwarf gradients is less understood. To investigate the origin of dwarf stellar age gradients, I use the large, varied sample of the Marvel and DCJL simulation suites.

A plot that shows galaxy radius on the x-axis in kpc and age percentile on the y-axis. Stars are binned by their age, and a colorbar ranging from red (old) to blue (young) depicts the age in Gyr. The stellar mass of the galaxy whose age gradient is depicted here is 7.87e8 solar masses. In this galaxy, we see that most of the young stars are at the center of this galaxy, with older stars on the outskirts. An age gradient plot like the previous, for a different dwarf galaxy with a stellar  mass of 7.87e8 solar masses. There are young stars across the entire galaxy, implying star formation lit up across this galaxy recently, thus making the stellar age gradient flat
Here I show two example stellar age gradients for two different dwarfs in our simulations. The stellar mass of each galaxy is at the top of each plot. The image on the left shows a steep gradient, with more of the youngest (bluest) stars clustered near the center of the galaxy, and the older (redder) stars more concentrated in the outskirts. On the right, we see an example of a galaxy with a flat gradient. Here, young stars are found across the entire galaxy, implying that star formation lit up across the galaxy recently, thus erasing the age gradient.)
A plot that shows 72 points (each representing a galaxy) on a plot with t_90 value on the x-axis (time at which 90% of stars have formed), and the age gradient on the y-axis. The galaxies are colored by their stellar mass. The gradients make a U-shaped trend, with the lowest mass galaxies stopping star formation early and having flat gradients.
Each dot on this graph represents a galaxy in our sample, with circles representing field dwarfs and stars representing satellite dwarfs. The x-axis shows t90 in Gyrs, which is the time when 90% of the stars in the galaxy formed, and the y-axis shows the age gradient of the galaxy. Each galaxy is colored by its stellar mass. Overall, we see that there's an overall U-shaped trend, with the lowest mass dwarfs tend to have a flatter age gradient, and also stopped forming stars very early. For the rest of the galaxies, there seems to be a trend between t90 and age gradient, with more recent t90 corresponding to a flatter age gradient.
Design from HTML5 UP.